






SleekPixel for uptime report cards
SleekPixel pulls the uptime percentage, incident count, and mean time to recovery from a single status-report post and renders a Twitter-card-ready monthly report. Customers see the headline number in the share preview without clicking through, which is exactly what trust-conscious buyers want.
♾️ Lifetime License available
Status pages need a monthly share image, not just a feed
Status-page software solves the live feed problem. What it does not solve is the marketing problem: telling customers that last month was a quiet month, in a format that travels on social and survives a screenshot. Most teams handle that by pasting numbers into a blog post and hoping social platforms generate a useful preview. They rarely do.
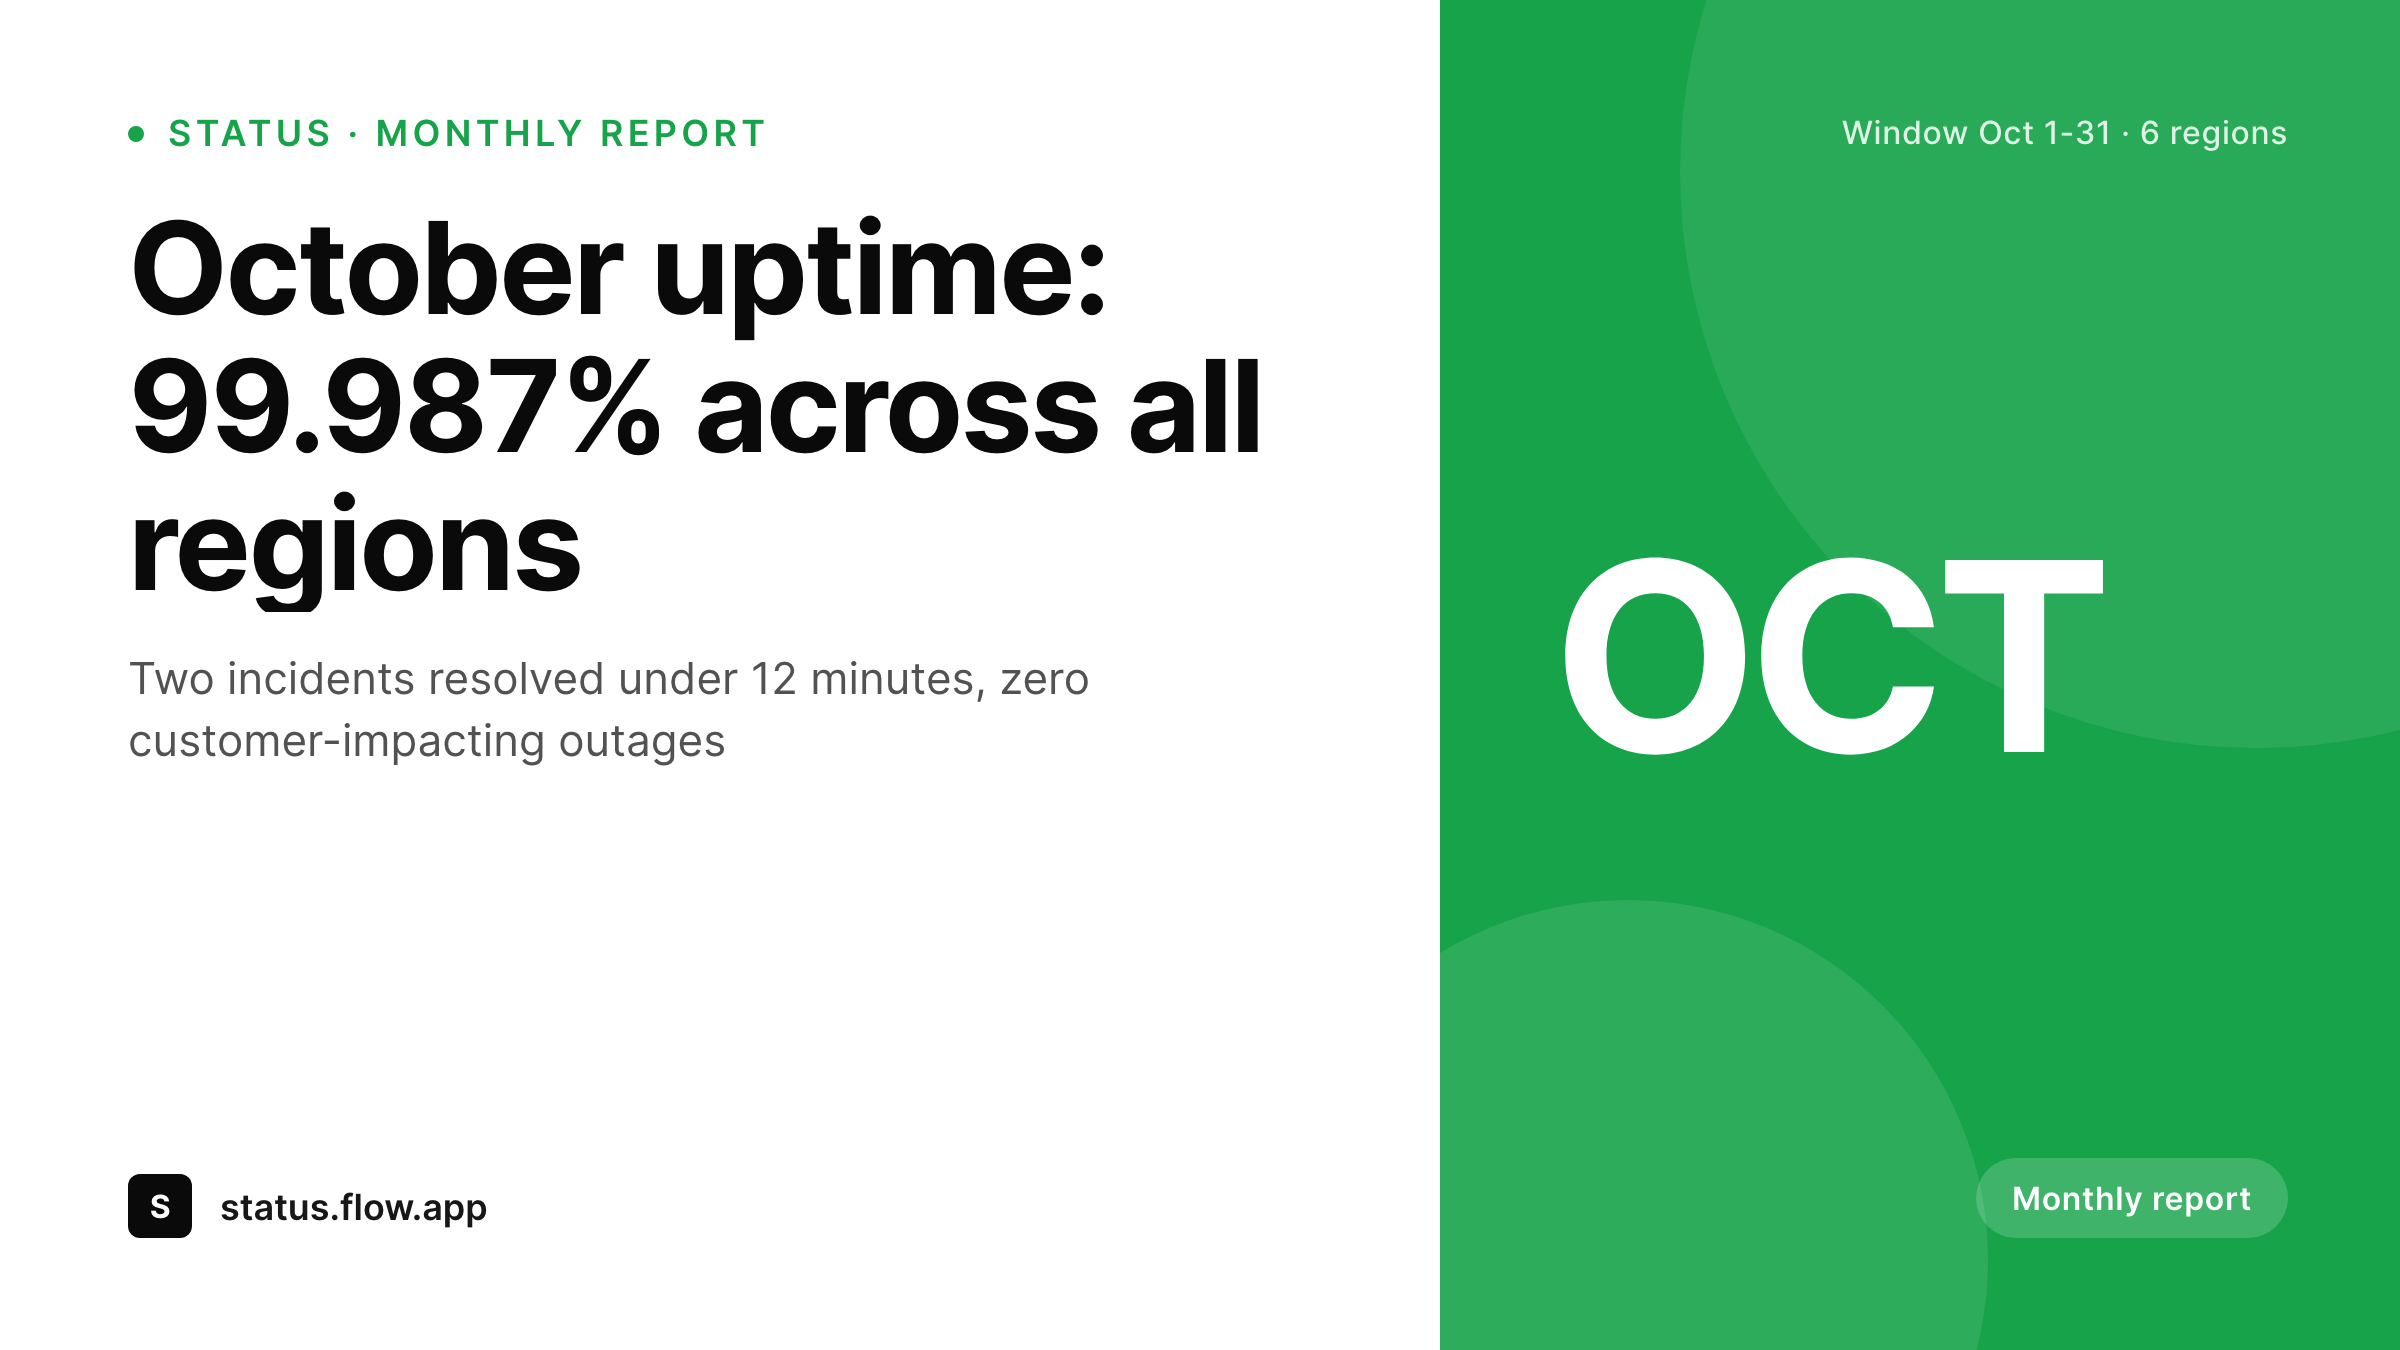
SleekPixel reads the status-report post's month, uptime_pct, incident_count, mttr_minutes, and regions fields, then renders a 1200x675 card branded for Twitter. The card surfaces the headline number in giant type, the incident count in a sub-line, and the time window in the footer. The full report stays in the post body for anyone who clicks through.
Every month, a new post; every month, a new card. The cards stack on a public reliability page so prospects browsing your trust portal see a real history of monthly performance rather than a one-time marketing claim.
Workflow
How a card renders, end to end
Create the monthly post
status-report CPT post for the month. Fields: month, uptime percentage, incident count, MTTR minutes, region list.
Bind the template
Save and render
Share and archive
Output
Sample monthly uptime card
Rendered from one report post: month label, uptime percentage, incident count, and mean time to recovery. The full breakdown lives in the post body.
Comparison
Default twitter card vs SleekPixel for uptime report cards
Plain status page link preview
- Status-page software produces a feed but no monthly summary graphic
- Marketing manually screenshots a graph each month and crops it
- Numbers in the post body and the share image drift over time
- Multi-region reports get reduced to a single misleading global number
- No record of past months in a visual format on the trust page
SleekPixel
-
Reads
month,uptime_pct,incident_count,mttr_minutesfrom the report post - Renders the headline number at typographic scale, legible at thumbnail size
- Region count visible in the footer for multi-region transparency
- Twitter-card 1200x675 plus an OG 1200x630 export from the same render
- Falls back to a month-and-percentage-only headline if MTTR is unset
Features
What SleekPixel gives you for uptime report card
Numbers-first layout
The uptime percentage is the headline. Everything else - incidents, MTTR, region count - supports it. The template was designed to look right at thumbnail size on a phone feed, not just on the post page.
Monthly cadence
One report post per month, one rendered card per month. The cadence enforces itself once you set up the template; missing a month is visible on the trust page as a gap.
Region-aware
Multi-region deployments report differently per region. The template supports a list region for per-region uptime, optionally collapsed into a single global number for the headline.
Use cases
Where the card belongs
Monthly social post
Schedule the card as a tweet, LinkedIn post, or customer-newsletter hero. The headline number reads at thumbnail size, which is what social feeds reward.
Enterprise reviews
Customer-success teams attach the monthly card to QBR decks. Twelve cards make a year-in-reliability narrative without a designer rebuilding the slide each quarter.
Reliability landing page
Stack twelve months of cards as a visual history on the trust page. Prospects see a track record, not a promise.
The bigger picture
Why a monthly uptime card is a real artifact
Reliability marketing is a long game. A single 99.99% claim on a marketing page lands flat, but a stack of twelve months of monthly cards on a trust page tells a story that no marketing claim can match. The cards work because they are visible artifacts, not promises.
Each one names the month, the percentage, and the incident count - the three numbers any buyer wants. They are shareable, which means the customer-success team can hand them to prospects in deals without re-deriving the same figures every quarter. They are archivable, which means audit teams can reference them by date when something later goes wrong.
Most importantly, they are produced as a side effect of work that the engineering team already does. The numbers live in the postmortem and report posts already. SleekPixel just renders them into a visual.
The compounding effect over a year is what a trust page should look like: not a single hero metric, but a record. Buyers who care about reliability notice the difference immediately, and the buyers who do not care still get a consistent visual rhythm of activity from the vendor's social channels. Both audiences win from the same template.
Questions
Common questions about SleekPixel for uptime report card
Yes. The template has a list region that takes a comma-separated regions_uptime field and renders each region with its uptime percentage. Below five regions it stays readable; above that it can collapse to a 'see report' line.
Indirectly. Many teams ingest their status-page provider's monthly digest as a custom field on the report post, then let SleekPixel render the card from that data. The status page itself stays the live source of truth.
Add a major_incidents count and bind it to a separate region with a different accent color. The template can highlight that line in red without losing the overall format.
Yes. Editing the post and saving triggers a fresh render. Most teams only edit retroactively for accuracy fixes, not number revisions, so this is rare in practice.
Yes. Create a yearly report post with aggregated fields and bind a 'year-in-review' template. The cards stack visually on the reliability page so customers can see annual context.
The default template puts the headline at roughly half the card height. That holds up at thumbnail size on phone feeds. Adjusting it is template-level only; the data binding does not change.
Reliability-conscious buyers, yes. Especially in enterprise sales where SLA reviews are standard. The cards remove friction from those reviews by giving sales something pre-approved to send.
Yes, but most teams do the opposite. Showing a month with one major incident plus the recovery time builds more trust than hiding it. The template can apply a different badge label for those months.
Pricing
More than 1000+
happy customers
Explore our flexible licensing options tailored to your needs. Upgrade your license anytime to access more features, or opt for a lifetime license for ongoing value, including lifetime updates and lifetime support. Our hassle-free upgrade process ensures that our platform can grow with you, starting from whichever plan you choose.
Lifetime ♾️
Most popular
EUR
once
- Unlimited websites
- Lifetime updates
- Lifetime support
...or get the Bundle Deal
and save €250 🎁
The Bundle (unlimited sites)
Pay once, own it forever
Elevate your WordPress site with our exclusive plugin bundle that includes all of our premium plugins in one package. Enjoy lifetime updates and lifetime support. Save significantly compared to buying plugins individually.
What’s included
-
SleekAI
-
SleekByte
-
SleekMotion
-
SleekPixel
-
SleekRank
-
SleekView
€749
Continue to checkoutBrowse more
- Vimeo thumbnails
- TikTok profile banners
- Fanvue page banner
- Etsy cover photos
- Snapchat ad images
- Pinterest product pin covers
- Pinterest video pin covers
- Spotify playlist cover
- Discord event cover
- Pinterest Idea Pins
- Klaviyo email banner
- Twitch alert
- Telegram channel banner
- GitHub social preview images
- TikTok Now image