SleekPixel for growth chart cards
Type the weekly numbers into the post. SleekPixel renders the chart, the axis labels, and the growth delta into a branded share card on save.
♾️ Lifetime License available
Stop screenshotting Mixpanel for every Twitter post
The growth chart is the unit of social currency on indie startup Twitter. A clean upward line, axis labels at the right scale, a number at the top. Most teams produce that asset by opening a dashboard, dragging the date range, screenshotting the chart, cropping it, and uploading. The dashboard rebrands, the screenshot crop shifts, the resolution varies, the post looks like it came from whatever tab happened to be open.
The data behind a weekly chart is small. Eight or twelve points, a label per point, a single growth delta. That data is already going into the weekly recap post in WordPress, either typed manually or pushed from analytics. The chart asset can be rendered from those numbers instead of screenshotted from a dashboard.
SleekPixel renders a chart layer inside the share card from a bound array field. The points map to a line, the axis labels map to the dates, the growth delta sits in a corner. Every week the team writes the post, the chart is rendered to the brand template, and the share image is set.
Workflow
From numbers to chart card in one save
Design the chart template
Bind chart layer to a field
Write the recap post
Share the recap
Output
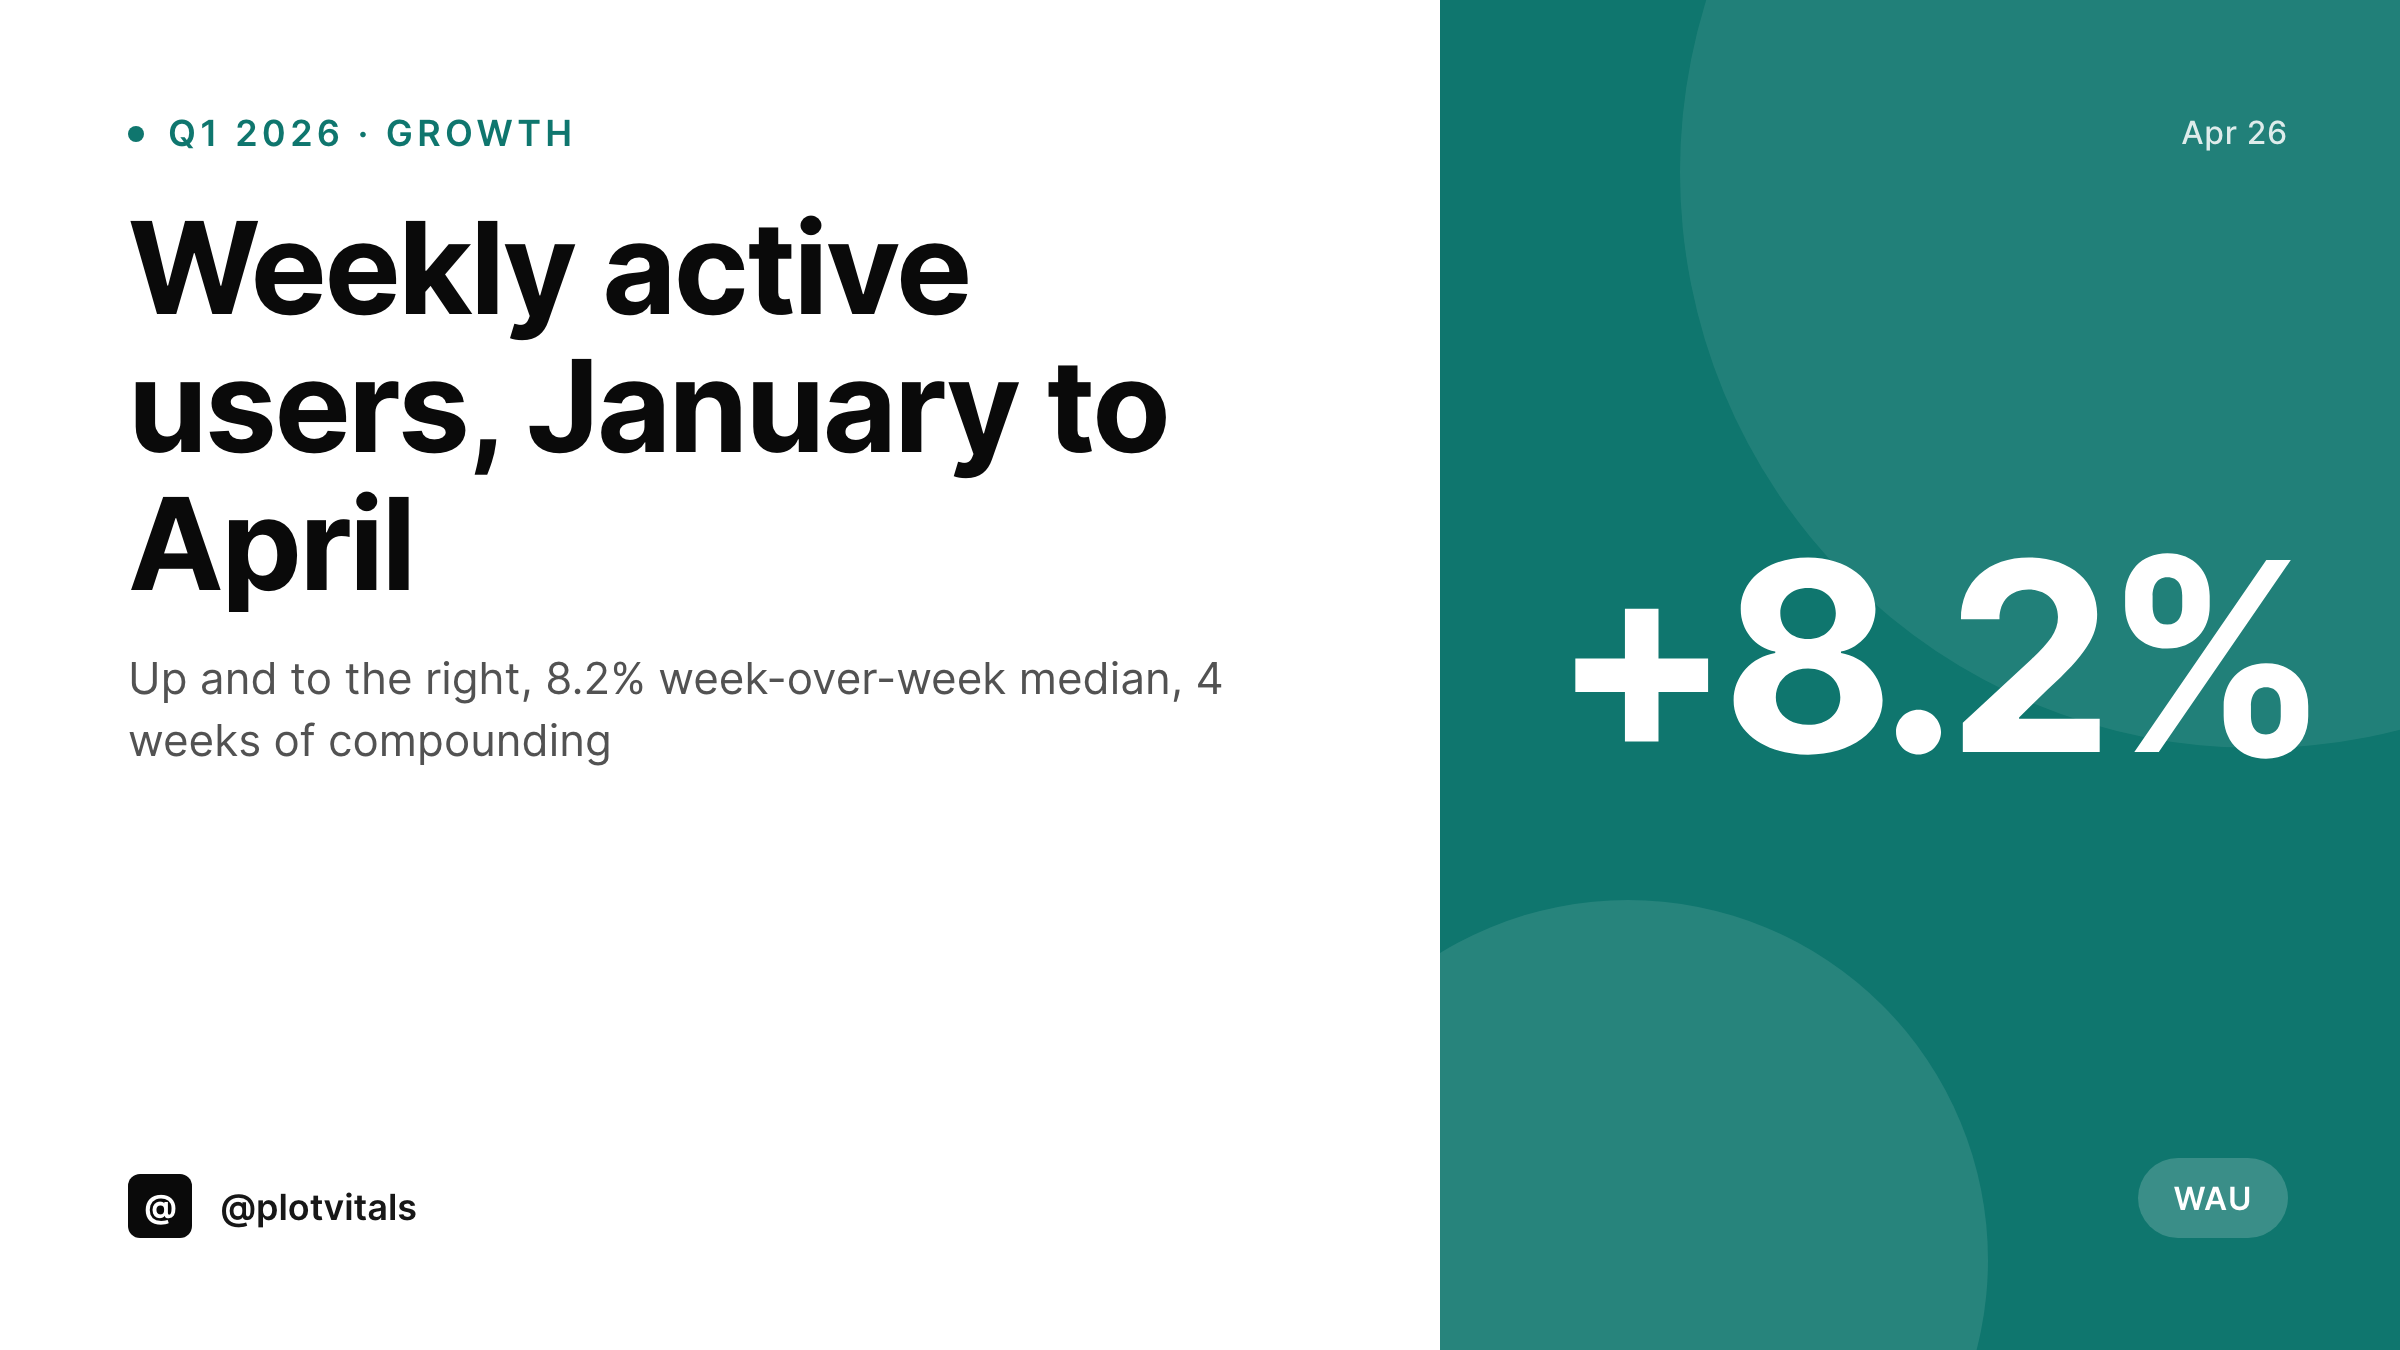
Sample growth chart card
A 1200x675 Twitter card with a rendered line chart, axis labels and growth delta, all from the post's data fields.
Comparison
Dashboard screenshot vs SleekPixel chart card
Mixpanel / PostHog screenshot
- Dashboard UI is in the screenshot, branding is the analytics tool's
- Crop varies week over week, scale shifts subtly each time
- Numbers on the chart are illegible on mobile
- Cannot bulk-rebrand without retaking every screenshot
- Chart shows what the dashboard wants to show, not what the post is about
SleekPixel
- Chart rendered from a bound array of values in the post
- Axis labels and growth delta bound to fields
- Consistent brand colors, fonts and scaling every week
- Renders on save with the rest of the share card
- Bulk regenerate all charts after a brand update
Features
What SleekPixel gives you for growth chart cards
Chart layers from data
A chart layer in the template reads an array of values from a post field and renders the line or bar with the brand color, axis, and scale you configure.
Brand-matched chart styling
Line color, axis weight, label font: all part of the SleekPixel template, not stuck to a dashboard tool's defaults.
Period label automation
Week range or month label auto-fills from the post date so the card always reads the right period without manual edits.
Use cases
Where growth charts get posted
Weekly recap threads
Founders posting a weekly thread about traction. The chart card is the visual lead at the top of the thread, sourced from the recap post fields.
Investor updates
Charts that travel out in monthly investor emails. Same template renders for the email's social card and the public-share version.
Open startup metrics
A company publishing live metrics. The chart card on social mirrors the chart on the open page, both reading from the same data field.
The bigger picture
Why rendered charts beat dashboard screenshots
A screenshot is the dashboard's brand wearing yours on top. A rendered chart is your brand carrying the dashboard's numbers. Investors and followers cannot tell from a screenshot which dashboard a startup uses and they should not have to.
The chart should look like an artifact the team produces deliberately, with the right scale, the right axis density, the right line weight. Once a team has fifty weekly recaps, the screenshot path has accumulated fifty inconsistent crops and the rendered path has fifty matching cards. The screenshot path looks like a side project.
The rendered path looks like a product. SleekPixel makes the rendered path the path of least resistance by tying the chart's render to the same save event the team is already doing for the recap post. The cost of consistency drops to zero, which is the only way it actually gets done.
Questions
Common questions about SleekPixel for growth chart cards
Line, bar, area, and sparkline as built-in chart layer types. Each reads from an array of values and a parallel array of labels. More complex visualizations stay in dedicated charting tools, but for the common weekly-recap case these four cover the work.
Yes. The chart layer accepts up to two bound series and renders them in two configurable colors. A weekly comparison of this week vs last week, or one product vs another, both work.
Yes. The chart layer auto-scales the y-axis to the data range with configurable padding. Manual min/max values can be set on the layer if you want to force a consistent scale across weeks.
Yes. Populate the values array via a custom integration that pulls from PostHog, Mixpanel, Plausible, or Google Analytics into a WordPress field on the recap post. SleekPixel reads the field at render time.
Update the field, save the post. The chart re-renders. The og:image URL stays stable so the next time the post is scraped, the new chart appears.
The full card PNG is the primary export. The chart layer is part of the rendered image. For a chart-only image, design a second template that contains only the chart layer at the dimensions you need.
Bar charts handle category data. Provide an array of category labels in parallel with the values array.
Yes. Bulk regenerate runs through every recap post and rebuilds the card with the current template, preserving the original data values. Useful after a brand refresh.
Pricing
More than 1000+
happy customers
Explore our flexible licensing options tailored to your needs. Upgrade your license anytime to access more features, or opt for a lifetime license for ongoing value, including lifetime updates and lifetime support. Our hassle-free upgrade process ensures that our platform can grow with you, starting from whichever plan you choose.
Lifetime ♾️
Most popular
EUR
once
- Unlimited websites
- Lifetime updates
- Lifetime support
...or get the Bundle Deal
and save €250 🎁
💎 Want everything forever? The All Access Pass is going away on 01.08.2026.
The Bundle (unlimited sites)
Pay once, own it forever
Elevate your WordPress site with our exclusive plugin bundle that includes all of our premium plugins in one package. Enjoy lifetime updates and lifetime support. Save significantly compared to buying plugins individually.
What’s included
-
SleekAI
-
SleekByte
-
SleekMotion
-
SleekPixel
-
SleekRank
-
SleekView
€749
Continue to checkoutBrowse more
- founder letter card
- salary report cards
- limited edition cards
- did-you-know card
- team offsite card
- demo day card
- changelog cards
- lesson thumbnail cards
- feature comparison cards
- testimonial cards
- infographic card snippets
- referral program cards
- weekly ship cards
- before-after comparison images
- guest post card
- Instagram stories
- Lemmy post images
- Snapchat ad images
- Amazon A+ content images
- LinkedIn banner images
- TikTok Now image
- Pinterest video pin covers
- Audible audiobook cover
- Lens Protocol posts
- Substack podcast cover
- Warpcast frame images
- LinkedIn event banners
- Lemon8 post
- Facebook group banners
- Kick channel banners